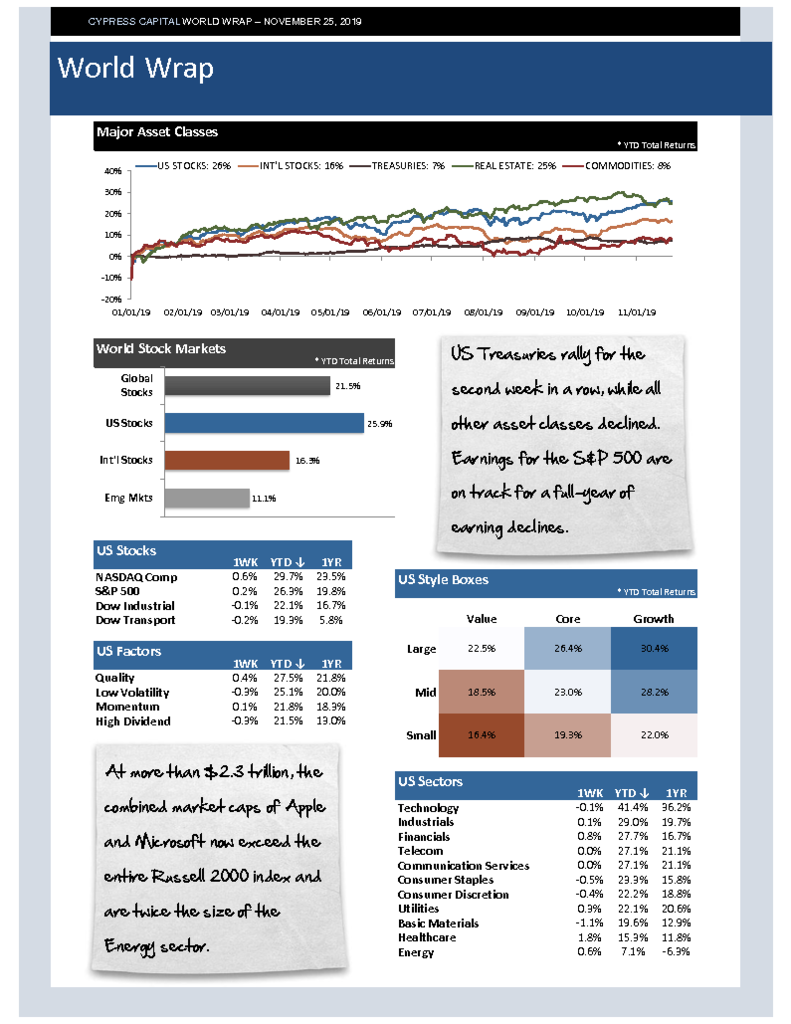
– US Treasuries rally for the second week in a row, while all other asset classes declined. Earnings for the S&P 500 are on track for a full-year of earning declines.
– At more than $2.3 trillion, the combined market caps of Apple and Microsoft now exceed the entire Russell 2000 index and are twice the size of the Energy sector.
– Sweeping election wins by pro-democracy candidates in Hong Kong over the weekend increases pressure on Beijing after months of unrest.
– WSJ reports that U.S. cos are pulling back on investment. Capital spending by S&P 500 cos grew less than 1% in Q3 and would have fallen without Apple & Amazon.
Archive
Market Outlook – Cluster of breadth warnings
– Market Risk Index ticks higher on slight deterioration in monetary conditions.
– NYSE triggers Titanic Syndrome, joining NASDAQ with a case of HOTS.
– NASDAQ High Low Logic Index crosses above 6%.
– Cluster of breadth warnings make this a notably more risky momentum market to chase.
World Wrap
– US Equities, Treasuries, & REITs climbed – Intl equities & commodities declined. Long-maturity Treasuries snap back to end recent losing streak.
– Style boxes line up uniformly in favor of large over small & growth over value ytd. Strong rallies from Utilities and Healthcare, as Healthcare is slowly clawing its way back.
– Longer term implications of trade war include a push by China to move away from a reliance on the US dollar, according to economists at ANZ bank.
– Concerns highlighted by Fed’s twice a yr report – high corp. & hedge fund leverage, lack of liquidity in futures mkts, & low rates encouraging too much risk-taking.
Market Outlook – Nasdaq has the HOTS
– Market Risk Index improves again but in territory that’s too high for defensive investors.
– Options traders enthusiasm has hit levels that tends to precede upticks in volatility.
– NASDAQ sees simultaneous trigger of both the Hindenburg Omen and Titanic Syndrome on multiple days this week.
%
Market Risk Index
Market Risk Index scales from 0 to 100%. Higher readings correspond with higher risk markets. Scores below 25% are bullish. Scores between 25-75% are neutral, and scores above 75% are markets vulnerable to major drawdowns.
Model Category Readings (Percentiles)
- Psychology 99.7%
- Monetary 87.2%
- Valuation 99.3%
- Market Trend 9.8%