Archive

World Wrap

World Wrap

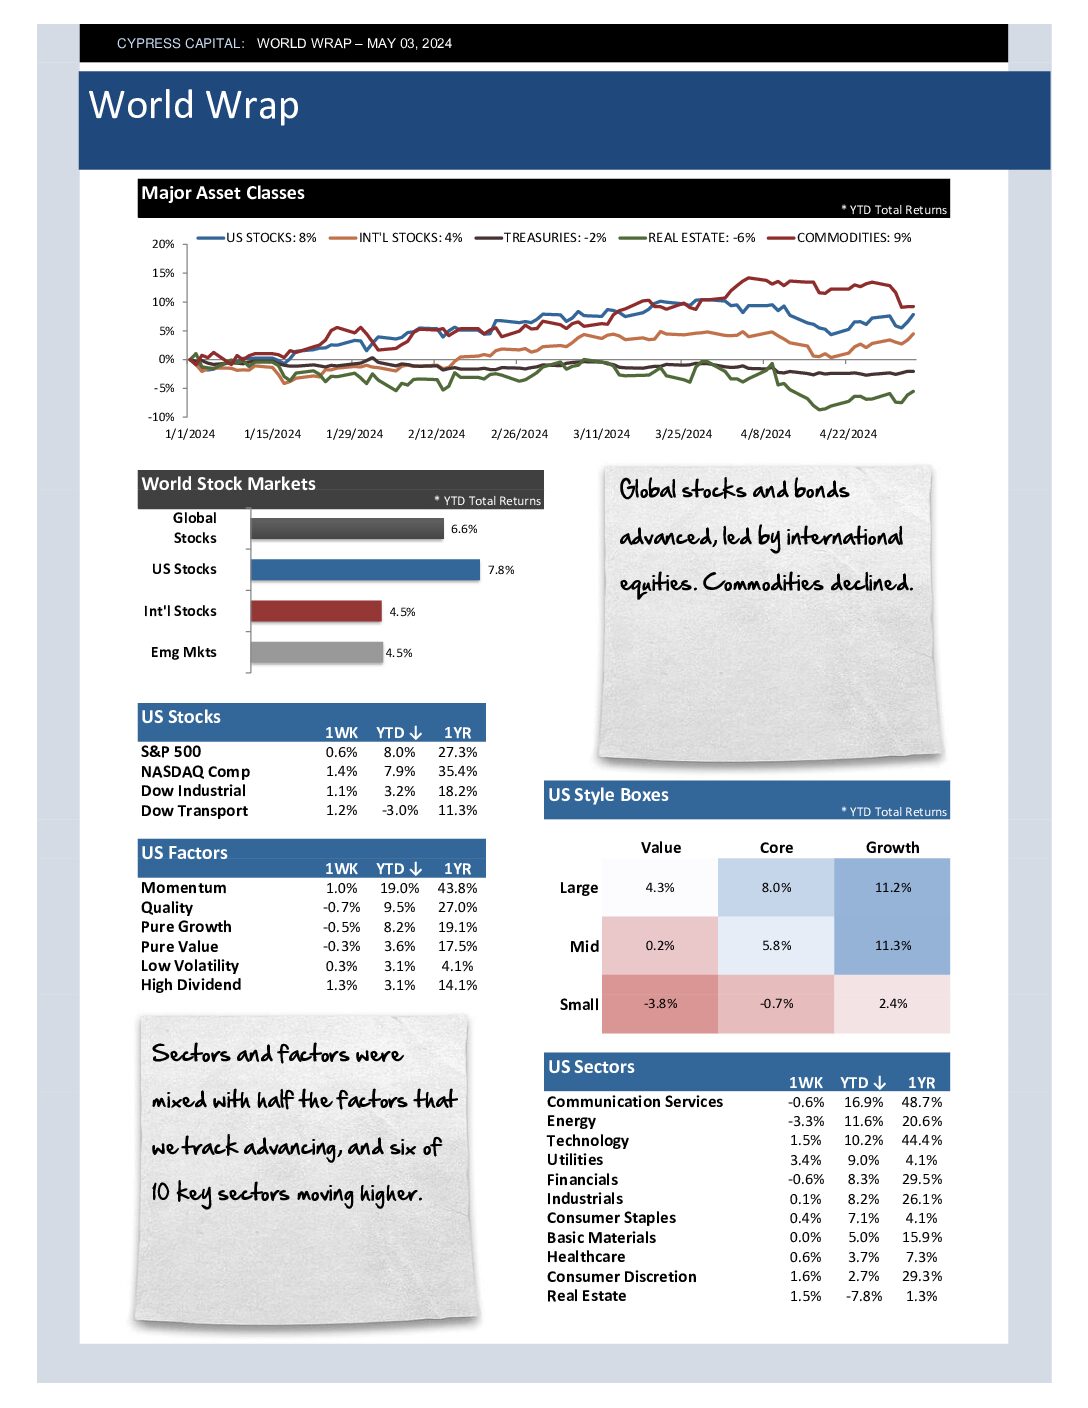
– Global stocks and bonds advanced, led by international equities. Commodities declined.
– Sectors and factors were mixed with half the factors that we track advancing, and six of 10 key sectors moving higher.
– Emerging Markets outperformed on the back of another robust weekly performance from Asian stocks.
– All broad commodity sectors slid with Energy prices faring worst. Crude oil futures fell nearly seven percent.

World Wrap

World Wrap

– Global equities snapped back with a rebound rally, while prices on US Treasuries fell.
– Tech and Large Cap Growth had strong performance. It’s still a narrow bull – the S&P 500 is outperforming all but 2 of 9 style boxes.
– Impressive move out of Asia – China and Hong Kong were up 8.2 and 9.5% for the week.
– Yields on the US 10Yr Treasury climbed as high as 4.7%, levels not seen since last November.

World Wrap

World Wrap

– All major asset classes fell with US Equities and Real Estate again being the worst performers.
– Financials, Staples, and Utilities climbed. Meanwhile, the Tech’s behavior as a safe-haven the week prior proved short lived. The Tech sector slid more than 7%.
– Thirty-nine of the 45 countries we track declined. The Asia region was hardest hit.
– Gold climbed, and Copper surged to a 52 week high. Global Fixed Income and Bitcoin struggled.

World Wrap

World Wrap

– Prices on all key global asset classes fell during the week. US Stocks and Real Estate were hardest hit.
– All sectors, styles, and factors declined. Large Cap Growth, driven by Tech stock performance, fared best.
– Emerging markets held up well in a down week – led by India, China, and Taiwan.
– Gold shot to another new all time high, and the US dollar was up a whopping 1.7% – surging to the highest level since November.

%

Market Risk Index

Market Risk Index scales from 0 to 100%. Higher readings correspond with higher risk markets. Scores below 25% are bullish. Scores between 25-75% are neutral, and scores above 75% are markets vulnerable to major drawdowns.

Model Category Readings (Percentiles)

  • Psychology 99.7% 99.7%
  • Monetary 87.2% 87.2%
  • Valuation 99.3% 99.3%
  • Market Trend 9.8% 9.8%